library(tidyverse)Why model?
We model because
- there is not enough data in our target subgroup
- we have a good idea to share information with other cases
To run the code on this page, you will need the tidyverse package.
We will also set the seed so that it is possible to exactly reproduce these results.
set.seed(90095)Generate an illustration sample
The code below will generate a sample of 100 respondents simulated to correspond to the target population ages 30–50 in 2010–2019.
simulate <- function(n = 100) {
  read_csv("assets/truth.csv") |>
    slice_sample(n = n, weight_by = weight, replace = T) |>
    mutate(income = exp(rnorm(n(), meanlog, sdlog))) |>
    select(year, age, sex, income)
}
simulated <- simulate(n = 100)# A tibble: 100 × 4
year age sex income
<dbl> <dbl> <chr> <dbl>
1 2011 48 female 24697.
2 2012 38 female 82433.
3 2013 38 female 86219.
# ℹ 97 more rowsTarget estimand
We will estimate three target quantities:
- geometric mean pay among female respondents age 30
- geometric mean pay among male respondents age 30
- ratio (1) / (2)
In our sample, there are only 3 female and 6 male 30-year-olds! We will need a model.
Models for illustration
We consider a series of three models.
- Flat model: Geometric mean among everyone
- Linear model: Prediction from linear fit on age \(\times\) sex
- Quadratic model: Prediction from quadratic fit on age \(\times\) sex
Recall that each model is a tool to share information from other cases in order to predict an estimate for the target subgroups: 30-year-old male and female respondents.
Rows: 420 Columns: 6
── Column specification ────────────────────────────────────────────────────────
Delimiter: ","
chr (1): sex
dbl (5): year, age, meanlog, sdlog, weight

ℹ Use `spec()` to retrieve the full column specification for this data.
ℹ Specify the column types or set `show_col_types = FALSE` to quiet this message.
`summarise()` has grouped output by 'sex'. You can override using the `.groups` argument.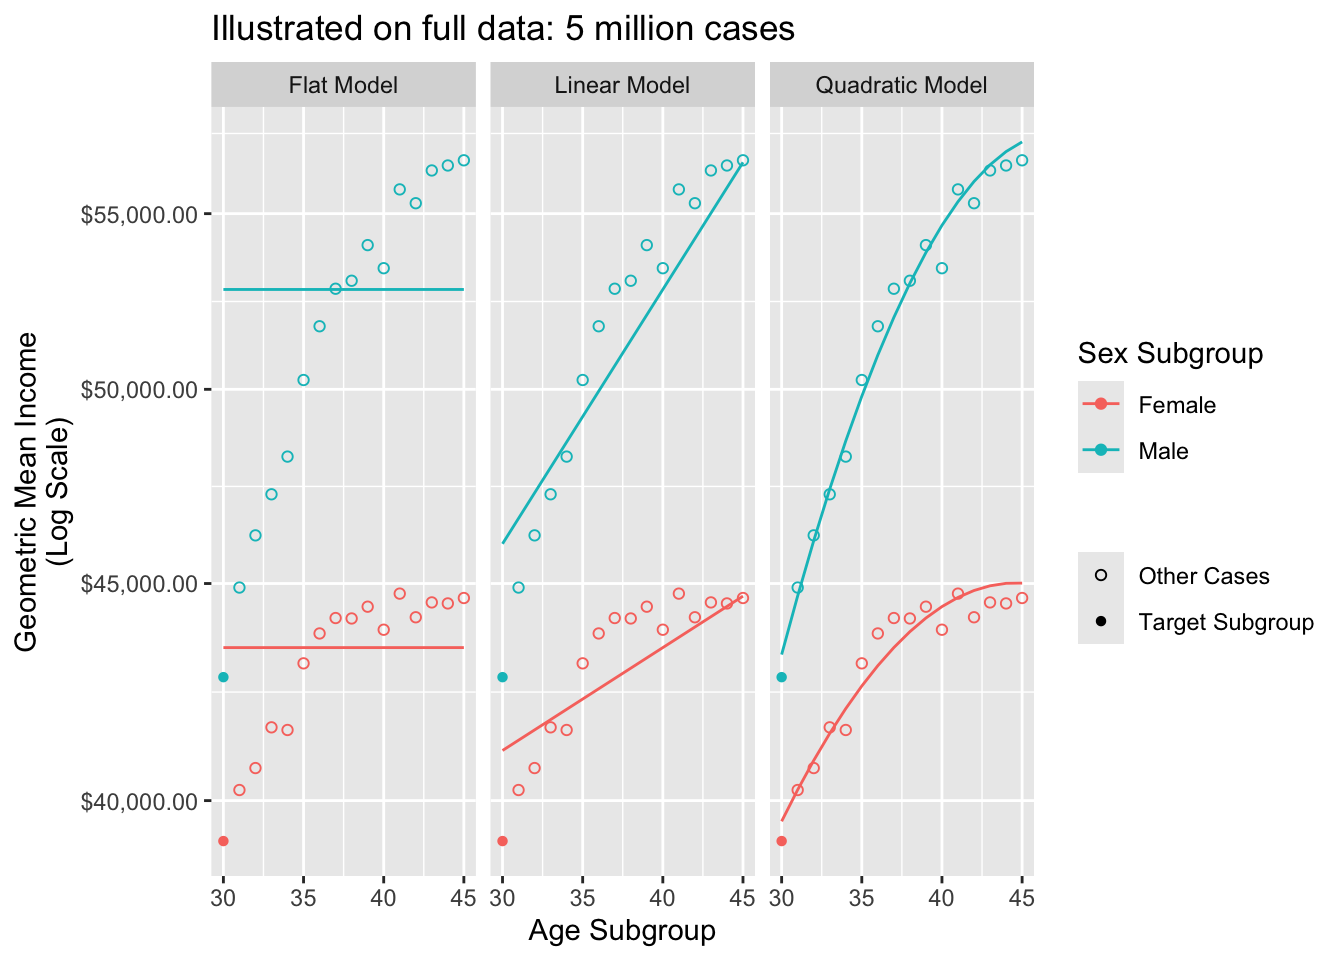
We will use these models for a task: estimate the geometric mean pay among 30-year-old male and female respondents. We will carry out the task in a simulated sample of 100 respondents.
Which model would you choose?
Think about an answer before going on to the next page.