source("https://ilundberg.github.io/eventhistory/assets/viz_survreg.R")Helper Functions
Translating survival models to quantities of interest (such as survival curves) can be cumbersome. While the exercise is worth doing once, students have suggested that it would be helpful to have functions that could carry out some of the steps automatically. Below are two functions that we use in the class to bundle these steps.
viz_survreg: Visualize a survreg model
The viz_survreg function visualizes a survival model estimated with the survreg function.
- The argument
xis a fitted model object of classsurvreg - The function prints a
ggplotobject with estiamted hazard and survival curves
Currently, this function only supports survreg models with dist = "weibull", dist = "exponential", or dist = "lognormal". It will plot the estimated curves at the minimum, median, and maximum values of the linear predictor \(\vec{X}'\hat{\vec\beta}\).
You can click viz_survreg to see the source code. You can load this function with.
To illustrate this function, the code below loads the first_marriage_duration data,
first_marriage_duration <- read_csv("https://ilundberg.github.io/eventhistory/assets/first_marriage_duration.csv")estimates a Weibull survival model,
weibull_model <- survreg(
  Surv(time, event = 1 - censored) ~ 1,
  data = first_marriage_duration,
  dist = "weibull"
)
and then visualizes the estimated model.
viz_survreg(weibull_model)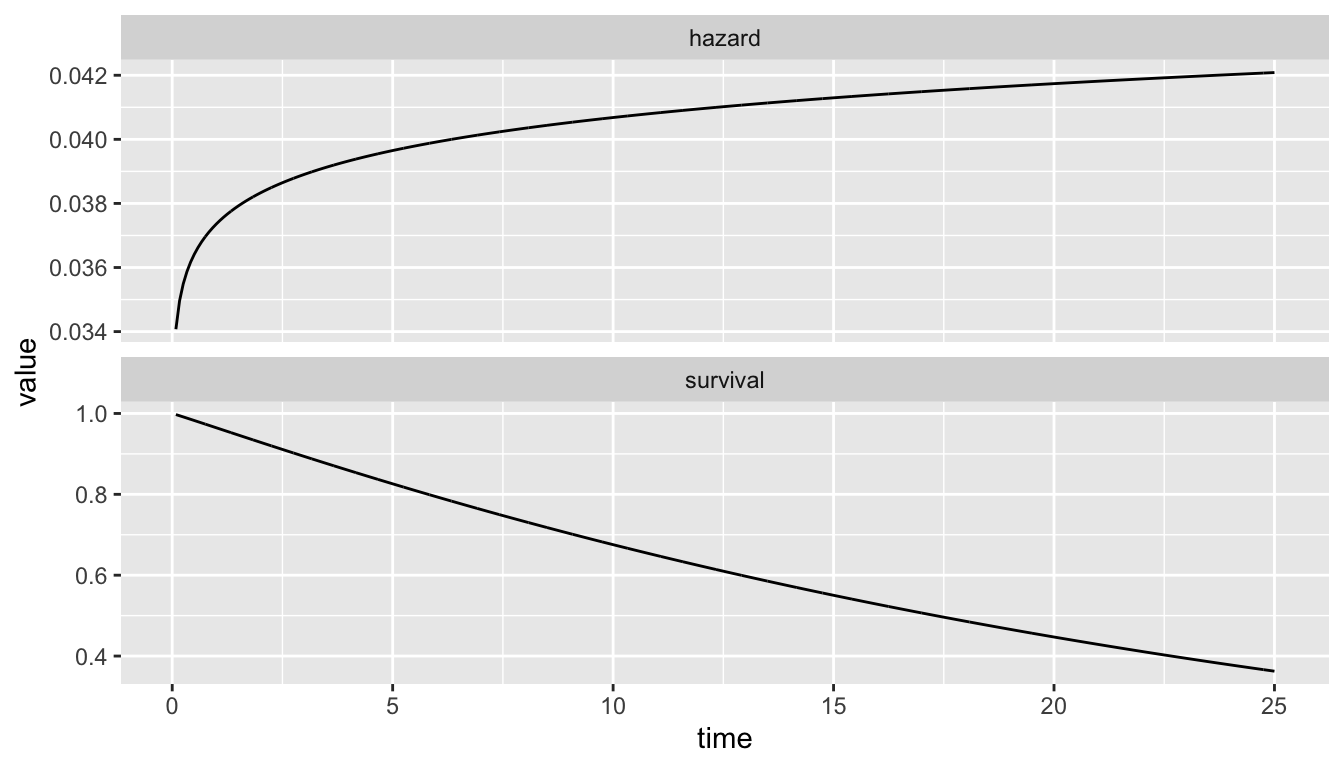
km_compare: Compare to Kaplan-Meier
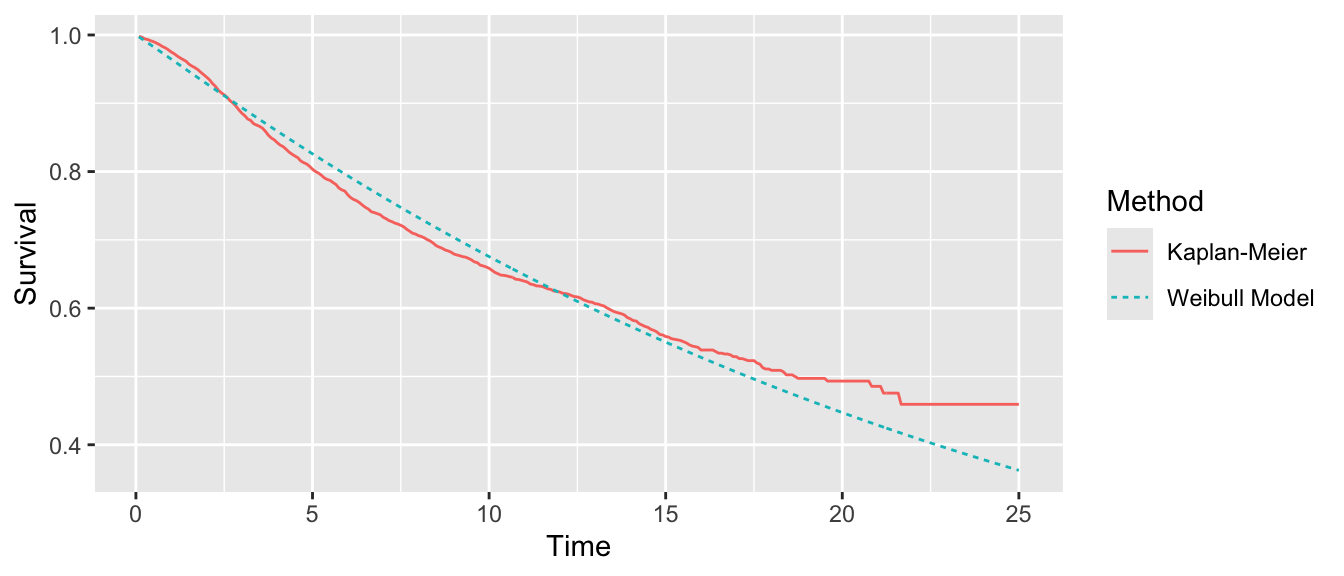
The km_compare function compares model-based survival estimates to nonparametric Kaplan-Meier estimates.
- The argument
xis a fitted model object of classsurvreg - The optional argument
subgroup_rowsis a numeric vector with the indices of cases from the fitted model object where you seek to make predictions.- If provided, the function will compare a Kaplan-Meier curve on this subgroup to the model-based predicted survival curve averaged over this subgroup.
- If not provided, the function will compare a Kaplan-Meier curve on the full data to the model-bsaed predictions averaged over the full data.
- The function prints a
ggplotobject with estiamted hazard and survival curves
Currently, this function only supports survreg models with dist = "weibull", dist = "exponential", or dist = "lognormal".
You can click km_compare to see the source code. You can load this function with.
source("https://ilundberg.github.io/eventhistory/assets/km_compare.R")To illustrate this function, the code below loads the first_marriage_duration data,
first_marriage_duration <- read_csv("https://ilundberg.github.io/eventhistory/assets/first_marriage_duration.csv")estimates a Weibull survival model,
weibull_model <- survreg(
  Surv(time, event = 1 - censored) ~ 1,
  data = first_marriage_duration,
  dist = "weibull"
)
and then visualizes the Kaplan-Meier comparison with the helper function.
km_compare(weibull_model)