heart_recipients <- read_csv("https://ilundberg.github.io/eventhistory/assets/heart_recipients.csv")Kaplan-Meier
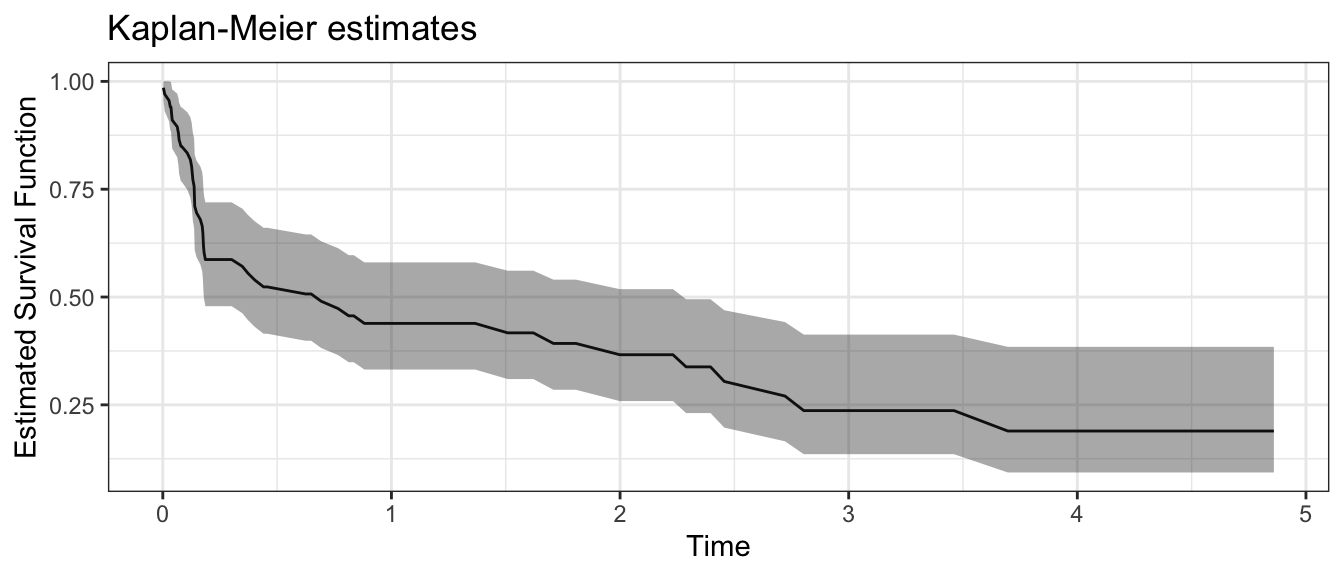
The Kaplan-Meier estimator is a nonparametric method to estimate a survival function in the presence of censoring.
For each unit \(i\) who dies at \(t_i\), let
- \(d_i\) denote the number of units who died simultaneously with unit \(i\)
- \(n_i\) denote the number of units alive just before unit \(i\) died
To survive to time \(t\), one must survive every moment preceding \(t\) when someone died. This motivates a survival curve estimate, \[ S(t) = \prod_{i:t_i\leq t}\left(1 - \frac{d_i}{n_i}\right) \] which at time \(t\) takes the product over all death times preceding \(t\) where the expression inside the product is the probability of surviving that death time.
A Kaplan-Meier curve is easy to estimate in R with the survfit function. Here we use the heart recipients data from the Exponential page.
First we learn the survival function,
kaplan_meier <- survfit(
  Surv(t, event = 1 - c) ~ 1,
  data = heart_recipients
)
and then we can plot it
plot(kaplan_meier)or with longer code can make a nice ggplot.
Code
kaplan_meier |>
  broom::tidy() |>
  ggplot(
    aes(x = time, y = estimate, ymin = conf.low, ymax = conf.high)
  ) +
  geom_line() +
  geom_ribbon(alpha = .4) +
  labs(
    x = "Time",
    y = "Estimated Survival Function",
    title = "Kaplan-Meier estimates"
  )
Kaplan-Meier on subgroups
The survfit function makes it easy to fit Kaplan-Meier survival curves for population subgroups.
kaplan_meier_subgroups <- survfit(
  Surv(t, event = 1 - c) ~ I(age >= 50),
  data = heart_recipients
)
This results in two survival curves estimated independently: one on each subgroup.
Code
kaplan_meier_subgroups |>
  broom::tidy() |>
  ggplot(
    aes(x = time, y = estimate, ymin = conf.low, ymax = conf.high,
        color = strata, fill = strata)
  ) +
  geom_line() +
  geom_ribbon(alpha = .4) +
  labs(
    x = "Time",
    y = "Estimated Survival Function",
    title = "Kaplan-Meier estimates",
    color = "Population Subgroup",
    fill = "Population Subgroup"
  ) +
  scale_color_discrete(
    labels = as_labeller(function(x) case_when(
      x == "I(age >= 50)=FALSE" ~ "Under Age 50",
      x == "I(age >= 50)=TRUE" ~ "Age 50+",
    ))
  ) +
  scale_fill_discrete(
    labels = as_labeller(function(x) case_when(
      x == "I(age >= 50)=FALSE" ~ "Under Age 50",
      x == "I(age >= 50)=TRUE" ~ "Age 50+",
    ))
  )
Warning: Removed 1 row containing missing values or values outside the scale range
(`geom_ribbon()`).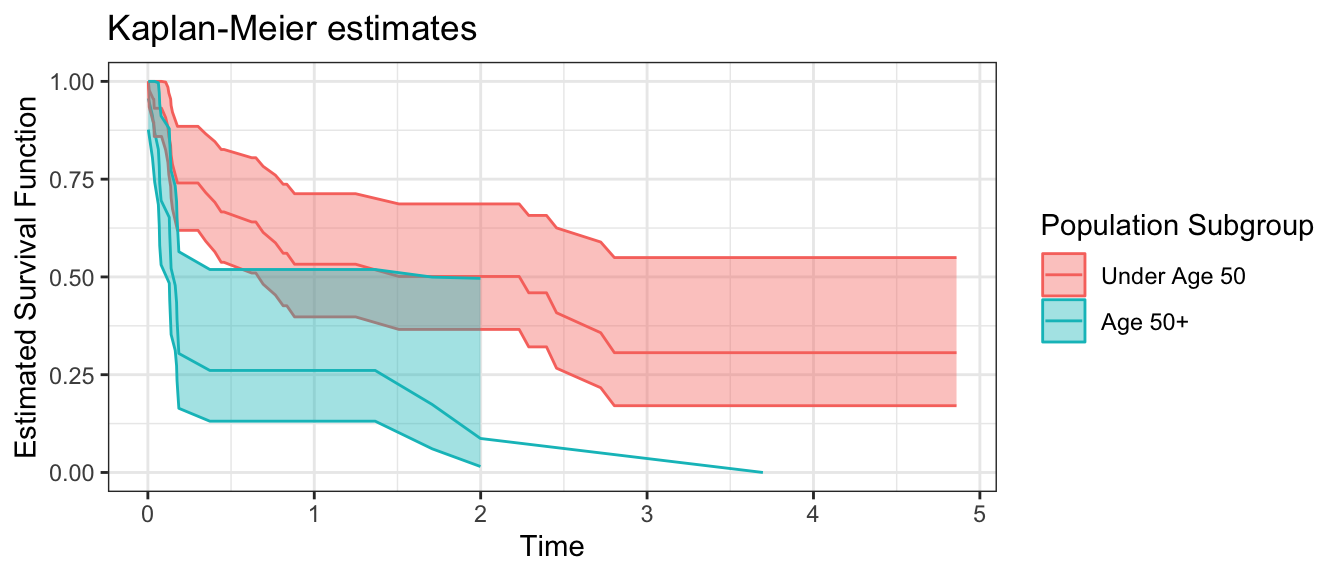
When to use Kaplan-Meier
The Kaplan-Meier curve is ideal for
- summarizing a marginal survival curve
- estimating survival in a few discrete subgroups
When there are many population subgroups defined by a vector of predictor \(\vec{X}\) such that few units are observed in each subgroup, then parametric models may be preferable.